XPrize Exhibit
Type of Work:
- Software Development
- User Testing
- Microcontroller Integration
- Sensors
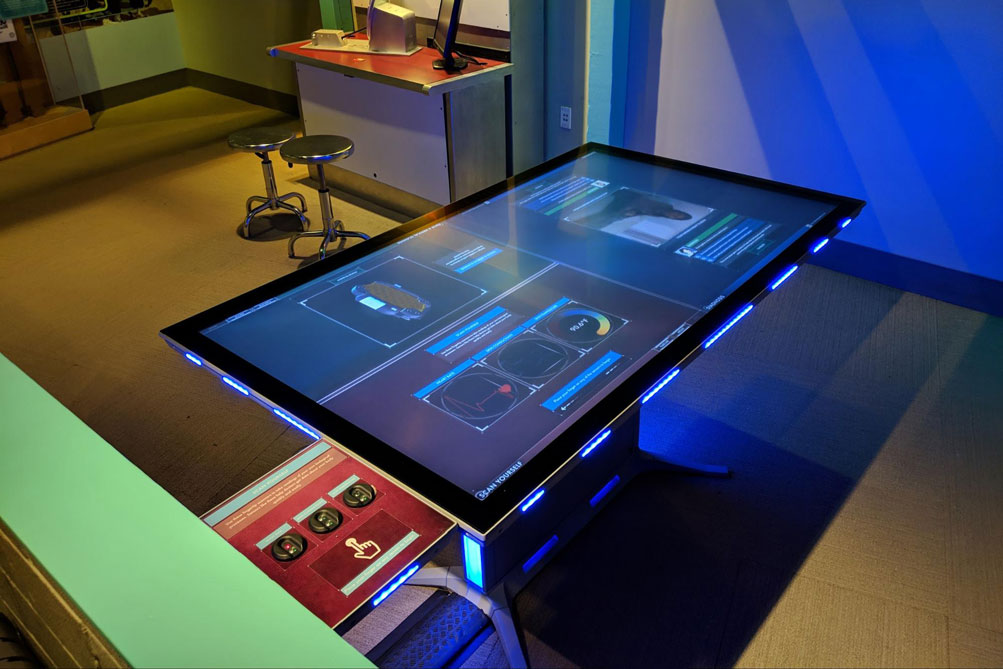
The Qualcomm Future of Medicine Table was an exhbit that was developed at Ideum (Ideum Portfolio Piece)in collaboration with the Qualcomm XPrize Foundation to help expand the public's knowledge of the work of the Qualcomm XPrize foundation as well as their medical device challege that ended in 2017. This exhibit was deployed into four different science centers all across the United States.
This application consisted of three different programs that operated on the same table, a series of embedded health sensors that communicated with the application, and finally a set of LEDs embedded in the table frame to provide a futuristic look. The application was developed in Unity, along with an Arduino that interfaced with the different health sensors.
This was an extremely fun and rewarding exhibit to work on and was deployed to five different science centers across the nation.
- Liberty Science Center
- The Tech
- Fleet Science Center
- Pacific Science Center
- Oregon Musuem of Science and Industry
Sense Yourself
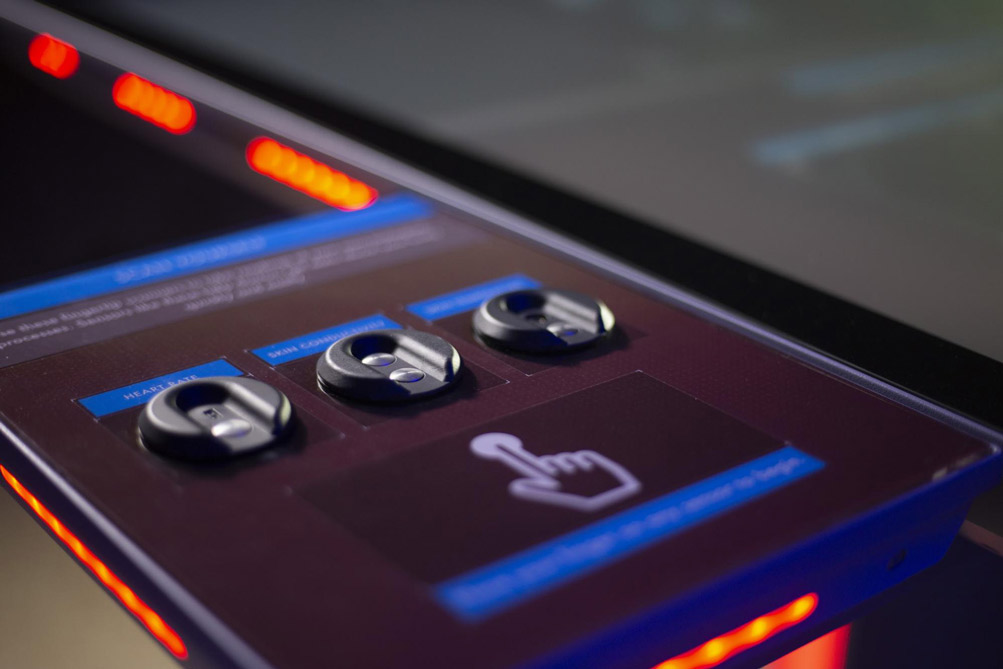
My main focus for this exhibit was the Sense Yourself portion. Sense Yourself consisted of three different health sensors displayed live statistics about the user's current health.
The three-finger activated sensors lived in a custom enclosure attached to an Ideum touch table. When a sensor was touched, it would activate a different view focusing on the relevant sensor.
Heart Rate Sensor
On the far left of the panel, a heart rate sensor read and displayed the visitor's current heart rate. This ended up being the most difficult of the three sensors to integrate. The main challenge was the tradeoff between the speed and accuracy of the sensor - the longer a finger was placed on the sensor, the more accurate and reliable the output would be to the actual heartrate of a visitor. A truly accurate reading, at a worst case, could approach 20 seconds of read time, which for a musuem exhibit is a very long time.
In order to ensure accurate readings and avoid frustrated vistors, I implemented a couple different solutions. The first was a countdown to inform the visitor of the state of the scan so that they wouldn't assume it was broken. The second was a prompt to retry the scan if the readings at the end of the countdown were unreasonably high or low which would indicate a poor reading from the sensor (or a severe medical emergency).
Once a heart rate was read, the application would prompt the user to do some form of exercise to see if they could increase their heart rate.
Galvonic Skin Response (Stress)
The middle sensor was a galvonic skin response sensor. It measures the amount of moisture on the skin and correlates that to the amount of stress a visitor is experiencing. This sensor was extremely easy to integrate, and it allowed us to graph the visitor's stress level over time.
Once a visitor places their finger onto this sensor, the application displays a running line graph displaying the users' current stress level as read by the Galvonic Skin response. It then prompts the visitor to either attempt to calm down, or do something embarrassing to see how their stress level changed.
Temperature Sensor
The rightmost sensor was a IR Temperature sensor that reads and displays the skin temperature of the visitor. This contactless temperature sensor was also extremely easy to integate into the aplication and provided a very accurate and repeatable skin temperature reading.
Once the skin temperature was displayed to the visitor, it would prompt them to rub thier hands together to see if they could increase their temperature, as well as an explaination as to the reasons the temperature may not have been what they were expecting. This additional explanation was added after user testing. Visitors were confused as to why the temperature they were seeing was not the usual 98.6 degrees. This disparity is due to the area that is being measured, the interal body temperature that everyone knows and is used to is 98.6 degrees, however average human skin temperature can vary drasticly based on individual and conditions. This is one of the interesting tables regarding human skin temperature, which is reproduced below.